
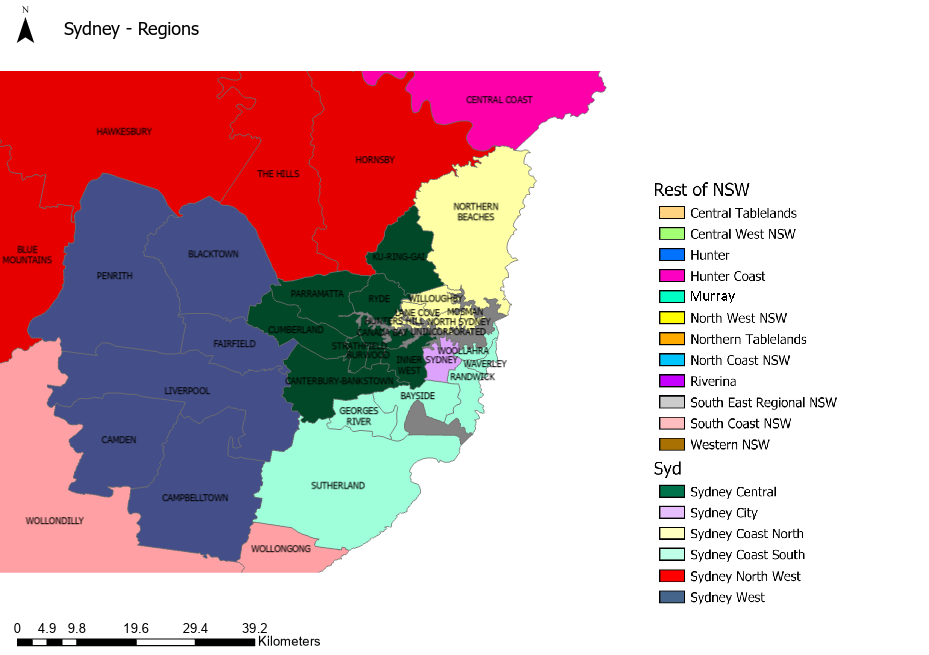
Land values in the Sydney Central region
Comprising of Burwood, Canada Bay, Canterbury-Bankstown, City of Parramatta, Cumberland, Inner West, Ku-ring-gai, Ryde and Strathfield local government areas.
General overview
The total land values for the Sydney Central region increased strongly by 23.2% between 1 July 2021 and 1 July 2022 from $484 billion to $596 billion.
Land value trends
| Property zone | 01 Jul 2021 | 01 Jul 2022 | % change |
|---|---|---|---|
| Residential | $432,480,347,657 | $527,810,834,135 | 22.0% |
| Commercial | $22,178,962,627 | $27,341,628,701 | 23.3% |
| Industrial | $22,298,835,142 | $33,170,080,521 | 48.8% |
| Rural | $3,286,180 | $3,931,210 | 19.6% |
| Other | $7,302,220,134 | $8,470,891,914 | 16.0% |
| Total | $484,263,651,740 | $596,797,366,481 | 23.2% |
Number of properties by zone
Total number of properties: 333,333
Residential land values
Residential overview
Residential land values in the region increased strongly by 22% overall. Increases were mostly consistent across all the region driven by accessibility to road and rail infrastructure, as well as a high demand for low-density residential sites suitable for dual occupancy development.
Median residential land values and sale prices
The above chart shows movement in the property market and land values over a five year period. In areas where there are a low number of sales, median sale prices may not accurately reflect the property market. Land values may not always move directly in line with sale prices due to the influence of other factors, such as building costs.
Local government area land values
| LGA | 01 Jul 2021 | 01 Jul 2022 | % change |
|---|---|---|---|
| Burwood | $15,047,842,184 | $17,788,440,125 | 18.2% |
| Canada Bay | $40,102,282,817 | $49,382,410,079 | 23.1% |
| Canterbury-Bankstown | $76,983,577,127 | $94,806,635,784 | 23.2% |
| City of Parramatta | $60,846,059,355 | $76,883,317,149 | 26.4% |
| Cumberland | $40,761,651,500 | $50,239,701,275 | 23.3% |
| Inner West | $75,857,951,714 | $81,539,128,133 | 7.5% |
| Ku-ring-gai | $63,293,142,080 | $79,111,713,550 | 25.0% |
| Ryde | $44,253,388,532 | $59,491,691,853 | 34.4% |
| Strathfield | $15,334,452,348 | $18,567,796,187 | 21.1% |
Commercial land values
Commercial overview
Commercial land values in the region increased strongly by 23.3% overall. This was due to consumer confidence returning to commercial property market. Very strong increases were experienced in Ryde (48.6%) where, Macquarie Park has been designated as a priority precinct.
Local government area land values
| LGA | 01 Jul 2021 | 01 Jul 2022 | % change |
|---|---|---|---|
| Burwood | $554,818,000 | $660,266,000 | 19.0% |
| Canada Bay | $1,037,851,629 | $1,159,006,720 | 11.7% |
| Canterbury-Bankstown | $4,306,434,286 | $5,046,296,404 | 17.2% |
| City of Parramatta | $3,400,335,430 | $4,575,052,600 | 34.6% |
| Cumberland | $2,345,447,440 | $3,066,192,957 | 30.7% |
| Inner West | $7,109,548,895 | $8,264,475,780 | 16.2% |
| Ku-ring-gai | $1,186,117,850 | $1,396,106,800 | 17.7% |
| Ryde | $1,589,729,184 | $2,362,574,518 | 48.6% |
| Strathfield | $648,679,913 | $811,656,922 | 25.1% |
Industrial land values
Industrial overview
Industrial land values in the region increased very strongly by 48.8% overall. This was driven by continued growth in e-commerce, logistics, improved road networks, such as the St Peters Interchange and M4 extension and a general shortage of quality industrial stock available to the market.
Local government area land values
| LGA | 01 Jul 2021 | 01 Jul 2022 | % change |
|---|---|---|---|
| Canada Bay | $419,126,700 | $579,438,600 | 38.3% |
| Canterbury-Bankstown | $6,419,608,981 | $10,292,613,271 | 60.3% |
| City of Parramatta | $4,605,852,151 | $7,202,886,150 | 56.4% |
| Cumberland | $5,886,482,670 | $8,748,915,630 | 48.6% |
| Inner West | $2,864,681,180 | $3,637,180,150 | 27.0% |
| Ryde | $271,458,100 | $399,838,000 | 47.3% |
| Strathfield | $1,831,625,360 | $2,309,208,720 | 26.1% |
Rural land values
Rural overview
Rural land values also increased strongly during the year at 19.6% overall, in line with the residential land. Canterbury-Bankstown is the only local government area in the region with rural zoned properties, albeit very few.
Local government area land values
| LGA | 01 Jul 2021 | 01 Jul 2022 | % change |
|---|---|---|---|
| Canterbury-Bankstown | $3,286,180 | $3,931,210 | 19.6% |